Postingan lainnya
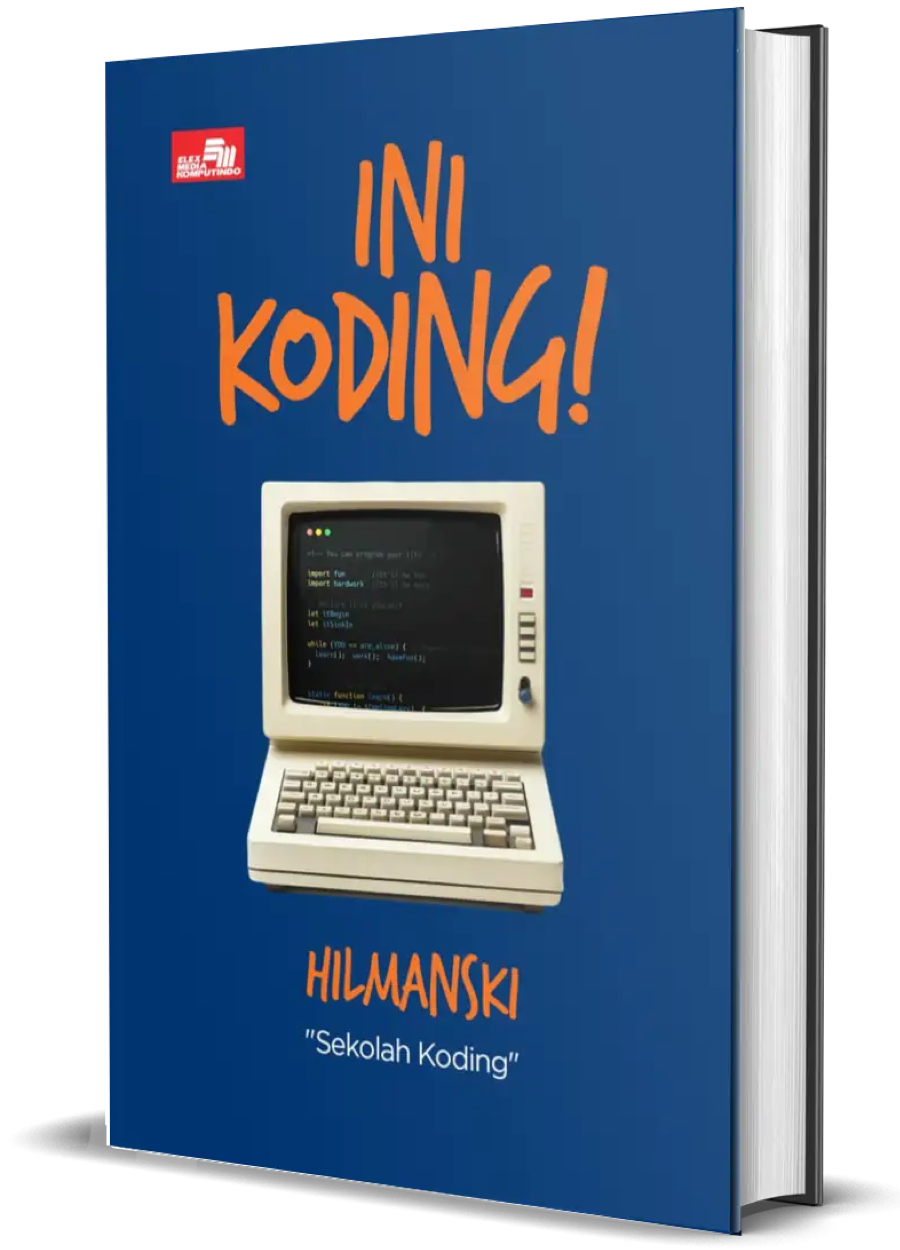
Buku Ini Koding!
Baru!
Buku ini akan jadi teman perjalanan kamu belajar sampai dapat kerjaan di dunia programming!
Kelas Premium!
Belajar bikin website dari nol sekarang
Gunakan kupon "lebihcepat" untuk diskon 25%!
Kelas Premium!
Belajar Javascript untuk website
Gunakan kupon "mulaijs" untuk diskon 75 ribu!
tab baru ketika bar chart di klik
ini js saya
 //basic bar chart
  if(jQuery('#barChart_1').length > 0 ){
    const barChart_1 = document.getElementById("barChart_1").getContext('2d');

    barChart_1.height = 100;

    new Chart(barChart_1, {
      type: 'bar',
      data: {
          defaultFontFamily: 'Poppins',
          labels: [
            "Jan",
            "Feb",
            "Mar",
            "Apr",
            "May",
            "Jun",
            "Jul",
            "Aug",
            "Sep",
            "Oct",
            "Nov",
            "Des"
          ],
          datasets: [
            {
              label: "Kejahatan Selesai",
              data: [
                {{ $jan_f_diagram_done }},
                {{ $feb_f_diagram_done }},
                {{ $mar_f_diagram_done }},
                {{ $apr_f_diagram_done }},
                {{ $mei_f_diagram_done }},
                {{ $jun_f_diagram_done }},
                {{ $jul_f_diagram_done }},
                {{ $aug_f_diagram_done }},
                {{ $sep_f_diagram_done }},
                {{ $oct_f_diagram_done }},
                {{ $nov_f_diagram_done }},
                {{ $des_f_diagram_done }},
              ],
              borderColor: 'rgba(58, 122, 254, 1)',
              borderWidth: "0",
              backgroundColor: 'rgba(58, 122, 254, 1)'
            },
            {
              label: "Kejahatan Progress",
              data: [
                {{ $jan_f_diagram_progres }},
                {{ $feb_f_diagram_progres }},
                {{ $mar_f_diagram_progres }},
                {{ $apr_f_diagram_progres }},
                {{ $mei_f_diagram_progres }},
                {{ $jun_f_diagram_progres }},
                {{ $jul_f_diagram_progres }},
                {{ $aug_f_diagram_progres }},
                {{ $sep_f_diagram_progres }},
                {{ $oct_f_diagram_progres }},
                {{ $nov_f_diagram_progres }},
                {{ $des_f_diagram_progres }},
              ],
              borderColor: 'rgba(58, 122, 254, 1)',
              borderWidth: "0",
              backgroundColor: 'rgb(234,67,53)'
            }
          ]
      },
      options: {
        legend: false,
        scales: {
          yAxes: [{
              ticks: {
                  beginAtZero: true
              }
          }],
          xAxes: [{
              // Change here
              barPercentage: 0.5
          }]
        }
      }
    });
  }
bagaimana cara pas kita click bar chart, langsung redirect ke detail data bar tersebut
1 Jawaban:
<div>Berikut adalah contoh kode penggunaan event pada Chartjs :<br><br></div><pre>{
data: {
datasets: [{
datalabels: {
listeners: {
click: function(context) {
// Receives click events only for labels of the first dataset.
// The clicked label index is available in context.dataIndex.
console.log('label ' + context.dataIndex + ' has been clicked!');
}
}
}
}, {
//...
}]
},
options: {
plugins: {
datalabels: {
listeners: {
enter: function(context) {
// Receives enter events for any labels of any dataset. Indices of the
// clicked label are: context.datasetIndex and context.dataIndex.
// For example, we can modify keep track of the hovered state and
// return true to update the label and re-render the chart.
context.hovered = true;
return true;
},
leave: function(context) {
// Receives leave events for any labels of any dataset.
context.hovered = false;
return true;
}
},
color: function(context) {
// Change the label text color based on our new hovered context value.
return context.hovered ? "blue" : "gray";
}
}
}
}
}</pre><div><br>Untuk informasi lebih jelasnya silahkan buka <a href="https://chartjs-plugin-datalabels.netlify.app/guide/events.html#listeners">https://chartjs-plugin-datalabels.netlify.app/guide/events.html#listeners</a> </div>
